Why is kinetic energy proportional to v^2?

November 23, 2013

I answered this question here, channeling this. That seems like the best answer – kinetic energy is proportional to v^2 because of Galilean relativity.

The more common answer, though, is to say that work is force times distance. Then because f=ma, we can show that the work done is proportional to the change in v^2. Ron, at least, is not satisfied with this approach, saying

The previous answers all restate the problem as “Work is force dot/times distance”. But this is not really satisfying, because you could then ask “Why is work force dot distance?” and the mystery is the same.

I’m not sure if this is the case. Suppose we assume that acceleration is some function of position, so

\mathbf{\ddot{x}} = a(\mathbf{x})

Then we have

\mathbf{\dot{x}}\mathbf{\ddot{x}} = \mathbf{\dot{x}} a(\mathbf{x})

\frac{1}{2}\frac{d}{dt}(\mathbf{\dot{x}}^2) = \frac{d}{dt} \int_{x_0}^{\mathbf{x}} a(\mathbf{x'}) ds

This shows that we can create a conserved quantity, namely \frac{1}{2}\dot{x}^2 - \int_{x_0}^{\mathbf{x}} a(\mathbf{x'}) ds, using just the knowledge f=ma, which doesn’t seem to be begging the question at all. It does, however, assume that the line integral is independent of path. So if we’re told f=ma and told that f is a gradient, we can find that kinetic energy is proportional to v^2. I suppose we ought to be able to, since from f=ma it is manifest that physics has Galilean invariance, and the thought experiment linked up top shows that energy depends on v^2.

So both explanations seem correct, but the one based on invariance certainly feels better.

Why You Keep Seeing Me

October 1, 2013

Yesterday afternoon I ran into a friend, by chance, for the third time that day.


“Why do I keep seeing you?” he asked.


“Good question,” I said, “you see, about eight light-minutes in that direction is a giant ball of gas called the sun. Inside, hydrogen under high pressure and temperature fuses into Helium. The Helium nucleus is lighter, so by E=mc^2 energy is given off in the form of photons…” and went on discussing atmospheric scattering, optics, the physiology of the retina, nerve impulses, a hierarchy of vision-processing mechanisms in the brain, the fusiform gyrus, grandfather neurons, and the nature of consciousness, all contributing to why he saw me.


But I was a bit surprised, as I dragged the joke on for a few minutes, how often I didn’t really understand what I was saying (and said it rather poorly). Hydrogen fuses to form Helium in the sun? Why does it do that? I thought I knew most of what there is to know about a single Hydrogen atom from my quantum mechanics courses, but put two of them together (and give the nucleus actual degrees of freedom) and i have no idea why they do what they do.


Today I ran across this quote from Tom Stoppard’s Arcadia:

It makes me so happy. To be at the beginning again, knowing almost nothing…. The ordinary-sized stuff which is our lives, the things people write poetry about—clouds—daffodils—waterfalls….these things are full of mystery, as mysterious to us as the heavens were to the Greeks…It’s the best possible time to be alive, when almost everything you thought you knew is wrong.

(quoted in Melanie Mitchell’s Complexity: A Guided Tour)

There is a lot of mystery in something as mundane as seeing a face you recognize. Fortunately, today many of the answers to these mysteries are known, if not in full detail, then at least in much greater detail than I know now. It’ll be interesting to find a few of these things out.

Simple experiments with beats and hearing

September 29, 2013

In the class I’m TAing, we are discussing beats. Beats are when you play two tones that are close to each other, but at slightly different frequencies. They will slowly drift from in phase to out of phase, like when your turn signal has slightly different timing from that of the car in front of you at a stop light. In sound, this results in the “wa-wa-wa” sound you hear when tuning two instruments to each other.

Beats depend on space as well as time. If two speakers play a tone, they can be in phase at one place and out of phase at another, since the distances to the speakers is different.  I had never actually played around with this with sound before, so I set up two speakers in a room where I could move both them and myself around pretty freely.

Making the speakers play the same pure tone (440 Hz), I found it was quite easy to observe the interference pattern of the speakers by moving my head around. And when the speakers were placed far enough apart, the phase difference could be quite different at opposite ears, so the sound would appear only in my left or only in my right ear. Also, by putting the speakers the right distance apart, I was able to observe turning the volume on the closer speaker up from zero and hearing the volume of the sound go down as the front speaker interferes with the back one. (It’s not practicable to make the sound seem to disappear entirely.)

Next, playing notes separated by 0.5 Hz, I found I could stand in one spot and hear the sound move from my left ear to my right ear and back again once every two seconds. This never sounded as if the source itself was moving around. Instead, the sound felt as if it was being played right next to my ear, even though the speakers were a couple meters in front of me.

These are just simple things, but still striking, since we rarely encounter coherent sound sources set up this way in daily life. Some time ago I did one other experiment accidentally that had an interesting result. I was listening to an app that creates beats by outputting different frequencies to the left and right audio channels, but I didn’t hear the beats. After a bit of confusion, I realized it was because I was wearing earbuds – there was no interference because nobody was getting both signals at once. Playing the tones through speakers instead, I heard the beats. However, when I turned the frequency down, I could hear the beats even with the earbuds. Somehow, your brain collects phase information about sound, but only if the sound is slow enough. The transition occurred somewhere around 600 Hz, or roughly a millisecond. This corresponds fairly well to the width of a nerve impulse, so a likely hypothesis is that you can only determine the arrival of the peak or trough of a wave to a time comparable to the width of a nerve impulse, which means you only have meaningful phase information down to around the 600 Hz I heard. (In a discrete Fourier transform, you have information about frequencies up to half the inverse of your sampling rate, so this checks out pretty well.)

The app I used was similar to this one, but I think my cheap headphones don’t process audio channels properly, as I can hear the beats even with one earbud in, both with that app and with WIkipedia’s file.

Answer: weights on a pendulum

September 25, 2013

The problem asked why weights are added or subtracted on top a pendulum, and also how much friction is needed to keep the weights from falling off.

The weights are added on top the pendulum to make it go faster when it’s too slow. Because the weights are above the pendulum’s center of mass, they raise the center of mass slightly, reducing the period.

One commenter suggested their purpose was to slow the pendulum by stretching it out, thus lowering the center of mass. The Young’s modulus of wood is roughly 10^10 N/m^2. The cross-section of that pendulum might be 5*10^-4 m^2, giving a characteristic force of 5*10^6 N. The weights are small, maybe 1N total, while the length of the pendulum is about 1m, so the stretch of the pendulum is only about 2*10^-6m.

The mass of the pendulum might be a few hundred times the mass of the weights, and they’re perhaps 5-10cm above the pendulum’s center of mass. So they raise the center of mass of the pendulum by about maybe .05cm, dwarfing the contribution from the stretching of the pendulum. The pendulum’s center of mass is moved by .05 percent, which changes the frequency by half as much (because frequency depends on length^(-1/2)). That’s a few parts in ten thousand, or around 10 seconds a day.

The weights are very unlikely to slip off, even if the friction is pretty low. The reason is that the tangential force on them (which comes from friction) is very small. They have nearly the same motion as the pendulum itself, and the non-gravitational force on the pendulum is directed purely radially.

When the pendulum is at an angle A from vertical, it experiences a tangential gravitational acceleration g sin(A). The weights feel the same gravity, but their actual tangential acceleration is only about 90-95% as large (based on being only 90-90% the distance from the pivot as the pendulum’s center of mass). So the weights experience a friction force of roughly .1 g sin(A) m.

At the peak of their oscillation, the normal force is g cos(A) m, and friction is limited to mu g cos(A) m. Thus, they will only slip if .1 sin(A) > cos(A) mu, or mu < .1 tan(A).

Weights on a pendulum

September 23, 2013

A friend of mine is one of the people in charge of winding a clock tower. He was showing my physics class how the tower works, and we were looking at the pendulum.

Here is a photo of the pendulum in question, from this blog.

We asked the class:

Why are there weights on the top of the pendulum?

This may sound like a bit of a trick question; one can come up with many possible reasons. But I’ll tell you that the weights are put there by humans deliberately as they maintain the clock. Sometimes they add a few and sometimes they take a few off.

A student then asked why the weights don’t slip off.

For a given pendulum length and swing amplitude, what is the minimum coefficient of friction to keep the weights from sliding off?

Not as interesting as I thought

September 19, 2013

As often happens, after writing yesterday’s post, it stuck around in the back of my mind, and I think I might be wrong about it.

Briefly, the background is that a friend was looking at lopsided results from a supposedly-random survey, and wondering whether they were really random. People warned her to be careful about her judgment because unlikely things are likely to happen. My conclusion was that we should estimate whether the survey was biased using Bayes’ formula, and I didn’t see a  place there for the “unlikely things are likely to happen” heuristic. I wrote

But “human biases” doesn’t seem to have any obvious spot in Bayes’ formula. The calculation gives a probability that doesn’t have anything to do with your biases except insofar as they affect your priors. Who cares whether the program has been used hundreds or thousands of times before? We’re only interested in this instance of it, and we don’t have any data on those hundreds or thousands of times.

and went on to say

In the end, the “unlikely events are likely to occur” argument doesn’t seem relevant here. If we looked at a large pool of surveys, found one with lopsided results, and said, “Aha! Look how lopsided these are! Must be something wrong with the survey process!” that would be an error, because by picking one special survey out of thousands based on what its data says, we’ve changed P(data|random). That is, it is likely that the most-extreme result of a fair survey process looks unfair. But we didn’t do that here, so why all the admonitions?

But since then, I’m unsure about my statement, “the most-extreme result of a fair survey process looks unfair. But we didn’t do that here”. It’s true that there is only one survey in question, and we aren’t picking the most extreme survey out of many. However, we are picking one particular thing that happened to someone out of many. And this can, I think, come into Bayes’ formula.

A good Bayesian must use every bit of available evidence in their calculations. The survey results are one piece of evidence, but another is the fact that we decided to analyze this survey. If the survey had come up with a fair-looking split, like 80 – 92 – 88, no one would have stopped to think about it. But we did stop to think about it. So Bayes’ formula should not be

P(random|data) = \frac{P(data | random)P(random)}{P(data)}

but

P(random|data + special\_notice) = \frac{P(data + special\_notice|random)P(random)}{P(data+special\_notice)}

If you have a large pile of surveys and you pick one up at random intended to see whether it looks fair, then notice that its results look wonky, you are perfectly justified in saying there might be something wrong with the survey process. If you have a large pile of surveys and you root through them until you find one that’s wonky, you aren’t. The key isn’t the number of surveys that exist, since that’s the same in both cases. It’s that in the second case, the fact that you took notice of the survey changes the likelihood of seeing skewed results, and this must be taken into account. So at least preliminarily, until I change my mind again or get some more-expert feedback, I eat my words on what I said yesterday.

Unnecessary Truncation

September 19, 2013

We should consider every day lost

-Friedrich Nietzsche

You miss 100% of the shots

-Wayne Gretzky

People often say motivation doesn’t last.

-Zig Ziglar

I hated every minute

-Muhammad Ali

We can’t help everyone

-Ronald Reagan

We all have dreams, but…

-Jesse Owens

I don’t know the key to success

-Bill Cosby

I don’t know where I’m going

-Carl Sandburg

Your time is limited

-Steve Jobs

Twenty years from now you will be more disappointed

-Mark Twain

… life is not worth living

-Socrates

You can never cross the ocean

-Christopher Columbus

I’ve learned that people will forget what you said

Maya Angelou

Fall seven times

-Japanese proverb

I would rather die

-Vincent Van Gogh

It does not matter

-Confucius

These quotes are culled from top Google hits, meaning many of them are probably false attributions, even in untruncated form.

How interesting is that license plate?

September 19, 2013

You know, the most amazing thing happened to me tonight. I was coming here, on the way to the lecture, and I came in through the parking lot. And you won’t believe what happened. I saw a car with the license plate ARW 357. Can you imagine? Of all the millions of license plates in the state, what was the chance that I would see that particular one tonight? Amazing!

-Richard Feynman (source)

A friend on Facebook commissioned a survey with three conditions, which were to be assigned randomly to participants (uniform distribution). The number of responses was

condition A: 58

condition B: 94

condition C: 108

total: 260

Seeing the lopsided result, she called the survey company to ask what was up. The representative said it was just random chance. How should one react? What sort of reasoning is useful here, and what is not? Is something strange going on with the survey?

If you crunch through some quick math, you’ll see that if the survey is fair, the odds of getting a result as extreme as 58/260 via random chance are a bit less than one in a thousand. (I’m accounting for over- or under-representation in any of the three categories.) How meaningful is that?

Suppose you are walking home and find a 20-dollar bill. The odds of that might be about 1/1000, but you likely don’t think anything fishy is going on. You chock it up to good luck and pocket the bill. But next suppose you remember a time when you found a 20-dollar bill when you were walking home as a little kid, and you realize you found it right outside your grandparents’ house (which you pass on the way), and they happened to be watching from the window when it happened. These circumstances don’t change the probability of finding a 20-dollar bill by random chance, but they change our estimate of the probability that finding the bill was a fluke. How meaningful an unlikely result is depends on not only how unlikely it is, but also on the plausibility of competing alternatives.

This is captured in Bayes formula. For the survey, it is

P(random|data) = \frac{P(data | random)P(random)}{P(data)}

where P(random|data) 
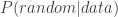
is the probability the survey process was a fair, uniform, random one given the observed 58-94-108 split. P(data|random) 
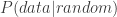
is the probability of observing our results given a fair random process. P(random) is the prior probability we assign to the process being a fair random one, and P(data) is the overall chance of seeing our 58-94-108 split under any circumstances, including unfair ones.
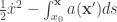
The easy one is P(data|random). It comes to 10^{-6} (see calculation here).

Discussion of the issue, then, ought to focus on estimates for P(random) and P(data). In part, it did

Are you counting people as they start the survey or as they finish? Because if it’s the latter, and option A is more work than the other two…

(suggests P(random) isn’t very high due to varying attrition rates, and that P(data) isn’t very low because varying-attrition could cause the observed bias.)

mostly I assume that it is random because randomness is pretty easy to code

(P(random) is high)

Actually, what you should be calculating is the Bayes factor, given the observed data, of a uniform distribution vs. a categorical distribution with a Dirichlet prior.

(Focuses on P(data). However, it suggests a slightly-different metric to look at than estimating the probability that the survey process is fair. Seems like a good suggestion, but it’s not my main point here.)

How does one calculate the probability that Qualtrics would make a mistake?

(focusing on P(random))

I believe that if something went wrong with that kind of coding, the outcome would look very different (like it would skip one group altogether)

(P(data) is low)

One thing everyone should keep in mind is that the alternative hypothesis here is NOT “their random number generator is broken.” (I mean, that’s possible, but it’s not on my list of top ten likeliest alternative hypotheses).

The alternative hypotheses here are things like “I misunderstood how to use Qualtrics ‘randomizer’ function.” Or, “Qualtrics intentionally assigns lower probabilities to longer test conditions.” Or “There’s a higher dropout rate in this test condition.” (Although I *think* that last hypothesis has been falsified by now.)

(Suggests why P(random) isn’t necessarily so high, and why P(data) is significant.)

Ultimately, the estimate you generate will be subjective, i.e. based on your priors and your assumptions about how to model the survey process. That’s why we see people using a lot of heuristic reasoning about the calculation – heuristics are how we deal with subjective estimates.

But in addition to discussion aimed at estimating the components that go into the Bayesian calculation, there was an entirely different type of heuristic reasoning, one focusing on human biases

I think Kahneman and Tversky did research on this? On coin flips people think HTHTTHT is more likely than HHHHHHH because it “looks more random.” Both are equally likely.

The funny thing about this (related to what A—- was saying) is that we’ve got research which shows just how difficult it is for human beings to accept randomness when they see it.

although a chi-square test shows that it’s a highly unlikely result, anything is possible, and it would be unusually NOT to see some unlikely results.

The statistical calculation only gives us the probability that such an outcome would occur. It doesn’t rid us of our preconceived notion that it should not occur, nor does it remind us that even low probability events occur quite often.

What I’m saying is that a program that has been used hundreds (or perhaps thousands?) of times to randomize subjects into conditions will often produce an outcome in the tails of the distribution.

The idea seems to be that one shouldn’t be alarmed just because your model says an event of low probability occurred. Even if your models of the world are in general correct, so many things happen that you’ll observe rare events once in a while. Further, we’re biased to make a big deal out of things, thinking they’re not random when they are. This bias in what we notice is the basis for Feynman’s joke – no one ever points out every mundane thing that occurs; only the few that seem surprising to them. Most, they don’t notice.

But “human biases” doesn’t seem to have any obvious spot in Bayes’ formula. The calculation gives a probability that doesn’t have anything to do with your biases except insofar as they affect your priors. Who cares whether the program has been used hundreds or thousands of times before? We’re only interested in this instance of it, and we don’t have any data on those hundreds or thousands of times. The only extent to which that matters is that if the program has been used many times before, it’s more likely that they’ve caught any bugs or common user errors.

In the end, the “unlikely events are likely to occur” argument doesn’t seem relevant here. If we looked at a large pool of surveys, found one with lopsided results, and said, “Aha! Look how lopsided these are! Must be something wrong with the survey process!” that would be an error, because by picking one special survey out of thousands based on what its data says, we’ve changed P(data|random). That is, it is likely that the most-extreme result of a fair survey process looks unfair. But we didn’t do that here, so why all the admonitions?

Another point made by commenters was that HTHTTHT is equally-likely with HHHHHHH given a fair coin, but only the second one raises an eyebrow. This is because HTHTTHT is one of a set of a great many similar sequences while HHHHHHH is unique. But this doesn’t seem relevant here, either. We didn’t look at the exact sequence of responses 260 (BBCABACCABAC…) and claim it was unlikely. All sequences are equally unlikely given a fair random process. But instead we looked at a computed statistic – the distribution of A, B, and C, which captures most of what we’re interested in. So again, why did commenters bring this up?

Maybe I’m missing an important point, but my guess is that it’s just pattern matching. “Oh, someone is talking about an unlikely thing that happened. Better warn them about Feynman’s license plate.” Of course, we do pattern-matching all the time because it usually works. But we also need to get feedback whenever our pattern-matching fails, then try to figure out why it failed, then try to update the pattern-matching software to work better next time, gradually giving fewer false positives and more true positives. There’s a tradeoff between them, and I’d guess it’s better to err on the side of committing false positives, since you can go build a general skill of going back and checking over what you’ve said carefully after initially pattern-matching it, especially in writing.

Blogging Update

September 18, 2013

For a long time I’ve updated this blog at best sporadically, often holding back from writing because I thought something wasn’t interesting or noteworthy enough, or that I wouldn’t write well enough or think clearly enough. Perfectionism is crippling; it’s not only the enemy of productivity, it probably lowers the quality of your stuff in the long run. So I intend to write more posts, and to do it by maintaining a low standard. Just a warning.

People Hearing Without Listening

August 21, 2013

I’ve seen several links and discussions today to this paper about judging classical music competitions.

The experimenter had people observe clips of musicians in competitions, then guess how well the musicians placed. Subjects guessed better when given video-only clips as compared to audio clips or audio+video clips. Conclusion: people care about looks far more than they think or admit they do.

But I think we can’t jump to such a conclusion based on this paper for a few reasons.

First, the clips were taken from the top three places at prestigious international competitions. These people are already the very best; there was probably very little variation between them. If we rate the auditory quality of the music they played out of 100, maybe they’re at 94, 95, and 96, or something. It’s not surprising that experts didn’t accurately judge who would win based on sound.

The failure of audio clips to predict competition placement is similar to how SAT scores aren’t very good predictors of the performance of Caltech students. If you took randomly-selected students from everyone applying to college and admitted them to Caltech, SAT score would be an excellent predictor of their success. But Caltech only admits people with very high SAT scores to begin with, so there’s not that much variation available to do the predicting.

Meanwhile, the variation in how the musicians move and express themselves physically could potentially be large – 50, 70, 90, for example. So even if judges base their scores mostly on the quality of playing, the visual aspect can still dominate the final rankings. The data don’t support the author’s claim “the findings demonstrate that people actually depend primarily on visual information when making judgments about music performance.” To show that, you’d need to show that visual information still trumps auditory information even when the players are not at about the same level. And it’s not like people with visual information did very well – they got to roughly 50% accurate. If you go from a distribution of 1/3 -1/3-1/3 to 1/2-1/4-1/4 you’ve reduced your entropy by about five percent.

Additionally, the clips used in this paper were six seconds long. So what we’ve shown is that you get a better quick, gut-instinct impression with visual than with auditory, but this doesn’t say a whole lot about the judges who were watching and listening to the entire performance.  (Edit: as a commenter pointed out, the paper contains a vague description of the results holding with clips of up to one minute.)

Perhaps visual aspects of the performance are correlated with auditory aspects. Further, maybe six seconds is enough time to get a good feel for the visual aspects, but not the audio aspects (six seconds might not even be one entire phrase of the music). In that case, expert judgments during competitions could be based almost entirely on the audio aspect, but people would still predict those judgments better from videos.

It’s interesting that people were bad at predicting which choice (audio, visual, audio+visual) would give them the best results, but people have very little experience with this contrived task, so it’s not especially surprising. Further, I think the conclusions of the paper are probably true – visual impressions matter a lot in music performance, but I hold that belief based on my general model of how people work. The evidence in this paper is somewhat lacking, and it’s disappointing that a news source like NPR fails to state the important fact that the clips were not complete recordings, but very short, six-second impressions.

Elsewhere:

NPR

John Baez

Robin Hanson